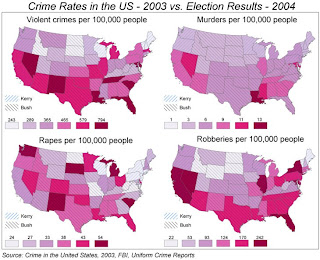
A Bivariate Choropleth Map is a choropleth map that depicts two different variables simultaneously through the use of two different data sets for the same region (and two different symbols). For instance, the map pictured here shows the crime rates in the United States of America in 2003, as well as the Election results in 2004. Crime rates were assigned a color (light to dark pink, saturation implicating the number of crimes per 100,000 people) and the election results were measured based upon final 'win' for the state. This map, in my opinion, is attempting to find a correlation between political affiliations and dangerous crimes committed in a certain area.
No comments:
Post a Comment